DIH Solutions ResearchBeta
Hotel Market Reports Germany & Switzerland
Current hotel market reports based on official statistics: demand and guest mix, supply and occupancy, year on year and for the current year.
Hotel Market Intelligence by DIH Solutions: a public market page and a two-page PDF report for every market. Official sources only, no estimates.
- Verified data sourcesOfficial · traceable · current
Hotel Market Reports
One report per market
Each report condenses a market's official figures onto two pages: annual development since 2019, the current year against the prior year and DIH Solutions market observations, with source and data period. You request it on the respective market page, in German or English.
Germany
11 reportsGermany, Berlin, Hamburg, Munich and more
- GermanyData through June 2026 · 2 pages · DE / ENGo to report →
- BerlinData through August 2026 · 2 pages · DE / ENGo to report →
- HamburgData through July 2026 · 2 pages · DE / ENGo to report →
- MunichData through August 2026 · 2 pages · DE / ENGo to report →
- FrankfurtData through June 2026 · 2 pages · DE / ENGo to report →
- DüsseldorfData through July 2026 · 2 pages · DE / ENGo to report →
- CologneData through July 2026 · 2 pages · DE / ENGo to report →
- StuttgartData through August 2026 · 2 pages · DE / ENGo to report →
- DresdenData through July 2026 · 2 pages · DE / ENGo to report →
- LeipzigData through July 2026 · 2 pages · DE / ENGo to report →
- PotsdamData through July 2026 · 2 pages · DE / ENGo to report →
Market Explorer
Explore hotel markets
Germany provides the national context and 10 city markets. In Switzerland, the national market as well as Zurich and Lugano are live. Each country follows the methodology of its official statistics.
Germany
National market + 10 city markets LiveBerlinData through August 2026Open research
Core markets
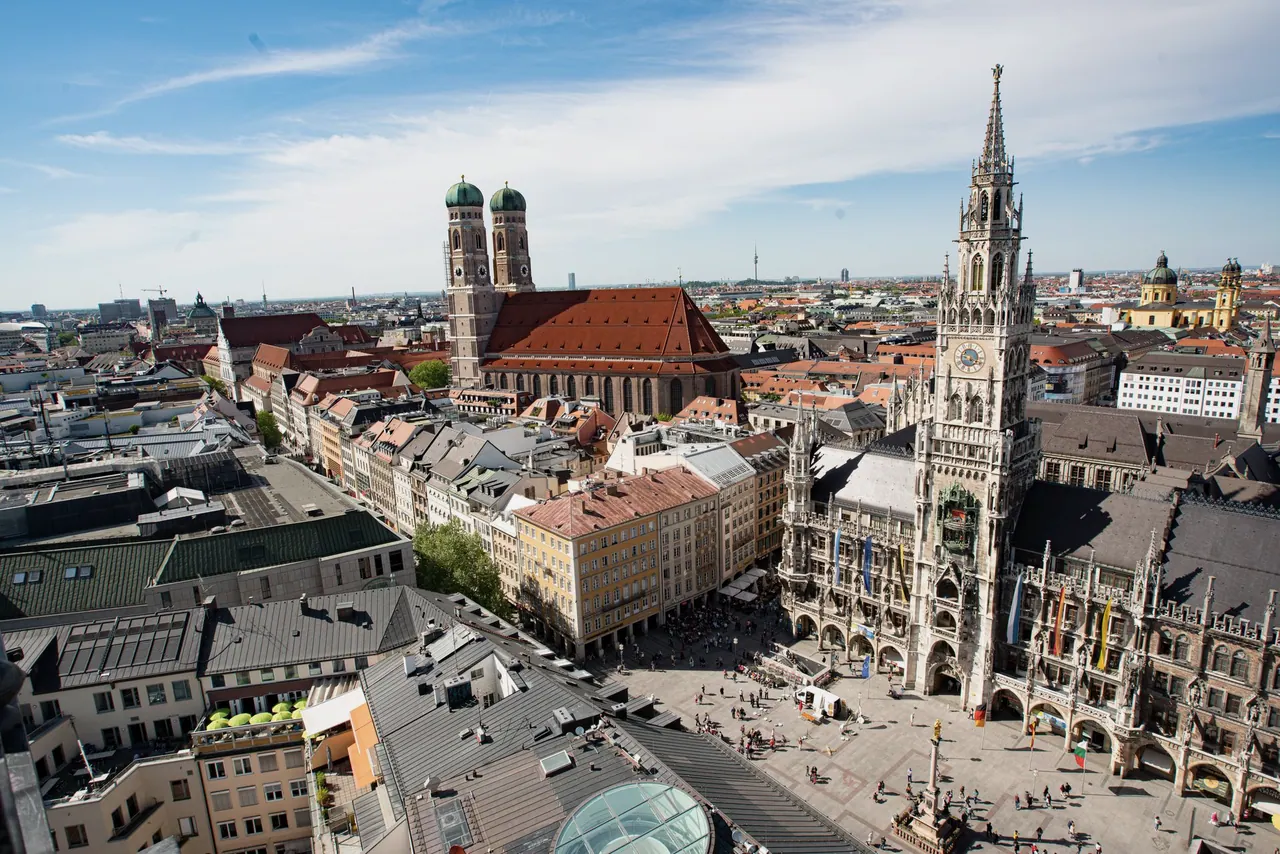 LiveMunichData through August 2026Open research
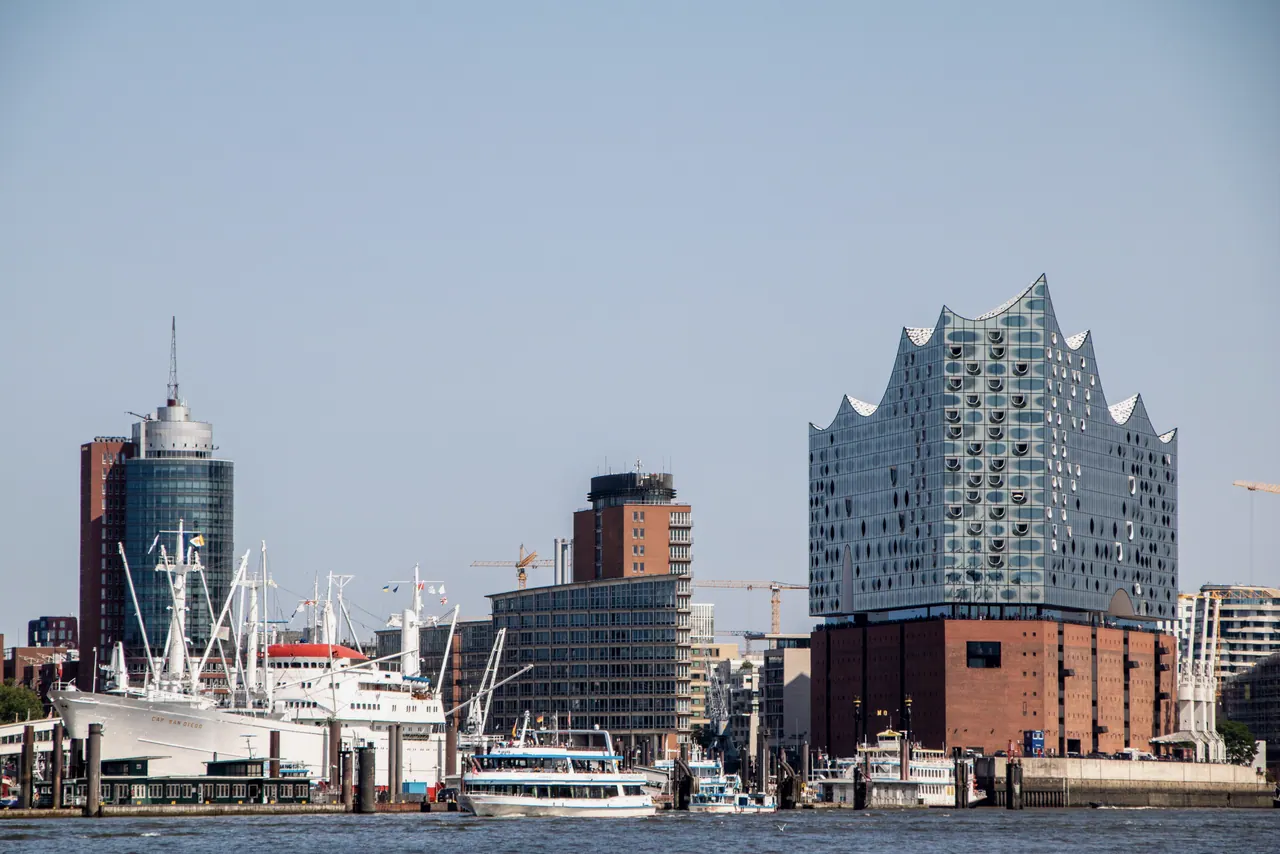 LiveHamburgData through July 2026Open research
 LiveFrankfurtData through June 2026Open research
 LiveDüsseldorfData through July 2026Open research
 LiveCologneData through July 2026Open research
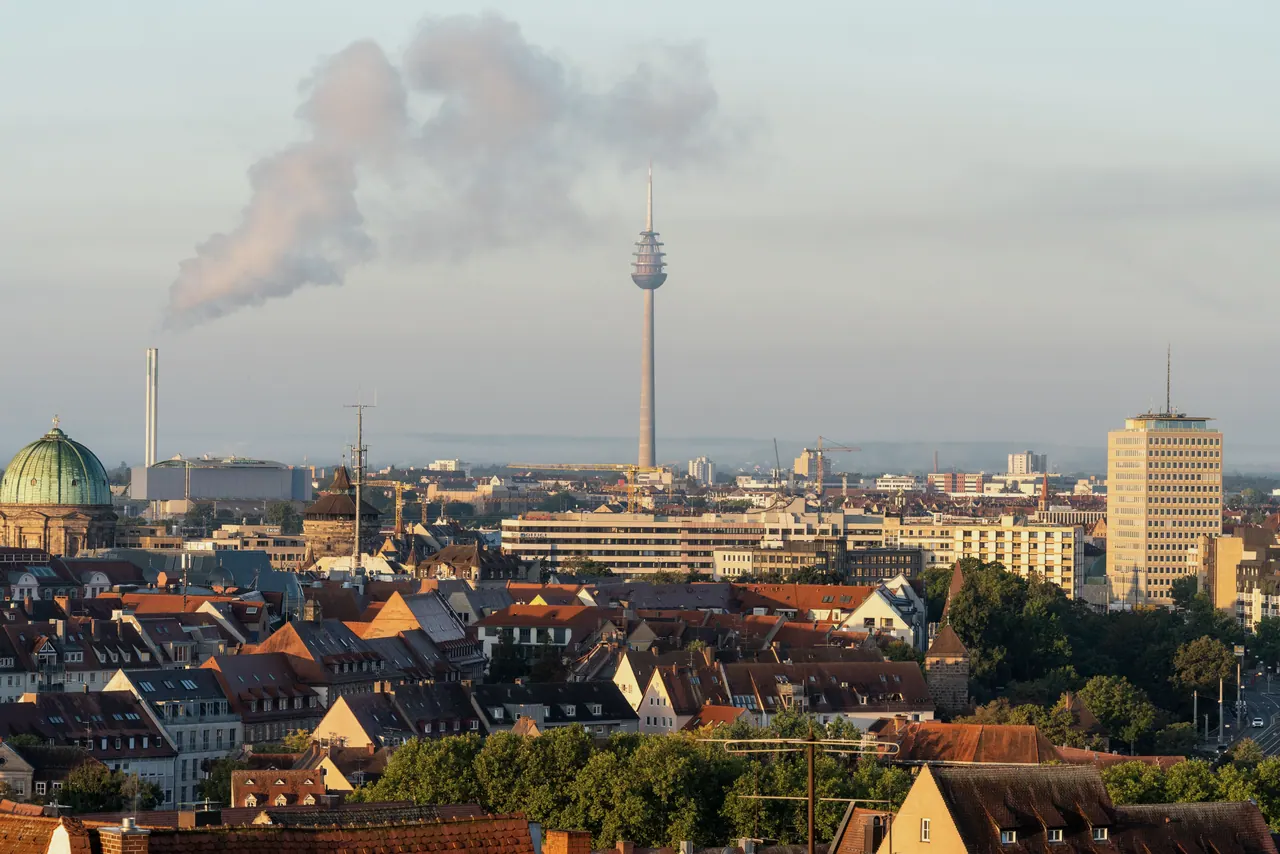 LiveStuttgartData through August 2026Open research
Additional markets





German City Markets in Comparison
Annual metrics refer to completed 2025. “Current through” indicates only the latest official reporting date. Switzerland is not part of this comparison because the BFS methodology differs.
| Berlin | 29.44 m | -3.8% | 86.3 | 55.5% | August 2026 |
|---|---|---|---|---|---|
| Munich | 19.68 m | -0.2% | 107.6 | 54.5% | August 2026 |
| Hamburg | 16.46 m | +2.1% | 106.7 | 56% | July 2026 |
| Frankfurt am Main | 11.02 m | -1.0% | 102.2 | 47% | June 2026 |
| Cologne | 7.22 m | +1.9% | 109.8 | 50.8% | July 2026 |
| Düsseldorf | 5.67 m | +2.2% | 113.3 | 42.1% | July 2026 |
| Dresden | 4.57 m | -1.4% | 97.1 | 48% | July 2026 |
| Stuttgart | 4.53 m | -2.7% | 110.8 | 50.7% | August 2026 |
| Leipzig | 3.69 m | -3.3% | 102.4 | 45.4% | July 2026 |
| Potsdam | 1.50 m | +5.0% | 112.1 | 51.3% | July 2026 |
Overnight stays are the primary comparison metric. Supply and occupancy scopes may differ by official source; each market page documents the authoritative scope.
Swiss City Markets in Comparison
Annual metrics refer to completed 2025. The source is the BFS HESTA accommodation statistics for each municipality; “Current through” indicates the latest official reporting date. Figures are not directly comparable with the German city markets.
| Market | Overnights 2025 | 2025 vs 2024 | Index 2019 = 100 | Net bed occupancy 2025 | Current through |
|---|---|---|---|---|---|
| Zurich | 4.18 m | +3.3% | 115.3 | 61.3% | August 2026 |
| Lugano | 564,862 | +2.8% | 110.9 | 52.8% | August 2026 |
Net bed occupancy refers to available net capacity as defined by BFS and is not the bed occupancy of the German state statistics. Each market page documents scope and methodology.
Research scope
What Hotel Market Intelligence covers
Every market page consolidates official accommodation and tourism statistics into a consistent picture of demand, origin mix, supply and occupancy. Only traceable official data is shown; no values are estimated or extrapolated. German and Swiss markets each follow the methodology of their source and are not mixed into a joint ranking.
Indicators per market
- Arrivals and overnight stays, annual and period comparison
- Index 2019 = 100 as a reference to the pre-pandemic level
- Domestic and international demand, plus the international share
- Average length of stay where officially reported
- Bed supply and bed occupancy
- Room occupancy where an exact official market-level scope is available
Data sources
Germany
- Statistisches Bundesamt (Federal Statistical Office) for the national market
- Amt für Statistik Berlin-Brandenburg for Berlin and Potsdam
- Statistisches Amt für Hamburg und Schleswig-Holstein for Hamburg
- Bayerisches Landesamt für Statistik for Munich
- Statistical Office of the Free State of Saxony for Dresden and Leipzig
- Hessian Statistical Office for Frankfurt
- Information and Technology North Rhine-Westphalia for Düsseldorf and Cologne
- Stuttgart Statistical Office and Baden-Württemberg Statistical Office for Stuttgart
Switzerland
- Federal Statistical Office (BFS), HESTA accommodation statistics: national total and municipality-level data for Zurich and Lugano
How the data is used
Demand growth, supply additions and occupancy are the basis for location assessment, operator selection and rent negotiation. That is where DIH Solutions advisory begins.
The data shown is based on official sources and is prepared by DIH Solutions Research. The presentation is a high-level market overview and does not constitute a project-specific feasibility, valuation or investment conclusion.
Hospitality.Made Investable.
Turning market data into a decision
Location and competition analysis, operator strategy, feasibility and rent underwriting – built on the same official data base.